What Sessions and Liquidity Are
The forex market operates across different financial centres around the world.
As one region becomes active and another becomes quieter, traders commonly divide the trading day into sessions.
The main sessions are generally referred to as:
- Sydney
- Tokyo / Asia
- London
- New York
Different sessions can produce different levels of activity, volatility and price movement.
Liquidity describes the availability of orders in the market — essentially, where buyers and sellers are available to transact.
Understanding sessions and liquidity together can help explain when markets are most active, where important highs and lows form, and why price may be attracted towards certain areas.
Key Takeaway
Sessions tell you when different parts of the global market are active. Liquidity helps explain where orders may be available for price to trade into.
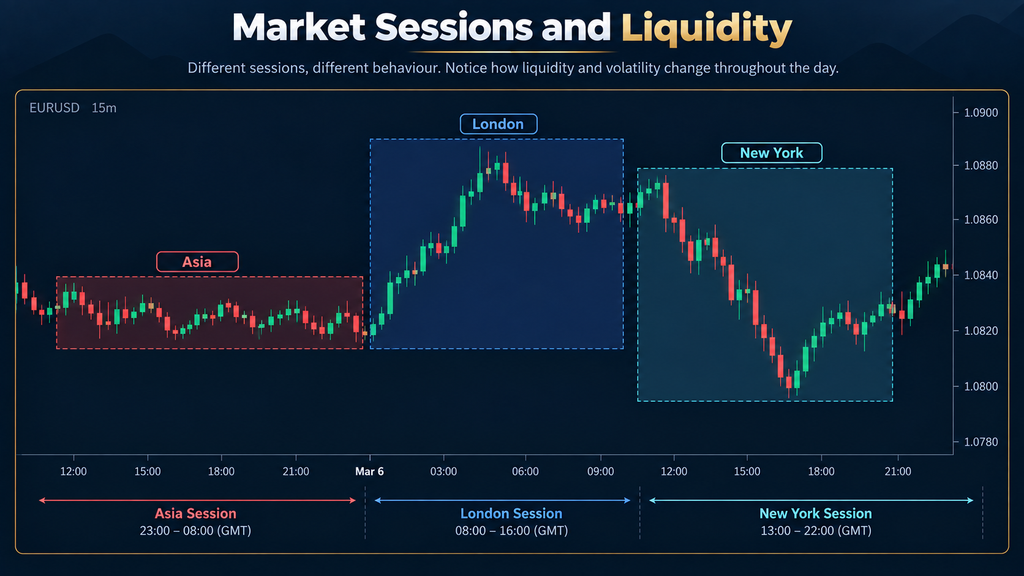
The Main Forex Sessions
- Forex trades throughout the working week
- Activity moves between major global financial centres
- Sessions overlap rather than starting and stopping instantly
- Session definitions can vary slightly between brokers and platforms
Commonly used local reference times are approximately:
Sydney: 08:00–17:00 Sydney time
Tokyo: 09:00–18:00 Tokyo time
London: 08:00–17:00 London time
New York: 08:00–17:00 New York time
These should be treated as practical reference periods rather than exact exchange opening bells because spot forex is a global decentralised market.
For many forex traders, London and New York receive particular attention because of the amount of activity that takes place during those periods.
Key Takeaway
Know which financial session is active before analysing an intraday forex chart.
Time Zones and Daylight Saving
- Session times should be understood in the session’s own local time
- Your local clock may show a completely different time
- London and New York change clocks during the year
- Different countries change clocks on different dates
- Fixed GMT or UTC conversions can therefore become wrong
This is extremely important for traders who live in different parts of the world.
For example:
London opens around 08:00 London time.
If you live in Asia, Australia, Europe or America, that may appear at a completely different time on your own clock.
New York should similarly be understood as 08:00 New York time, rather than memorising one permanent conversion.
London changes between GMT and British Summer Time, while New York changes between standard time and daylight-saving time.
The UK and US also change their clocks on different dates, meaning the normal time difference between the two can temporarily change.
Use a Session Indicator
Open TradingViewAffiliate link and search the Indicators section for:
- Forex Sessions
- Market Sessions
- Trading Sessions
- Session Boxes
- Session Highs and Lows
Where possible, choose tools that automatically account for regional time zones and daylight-saving changes.
Key Takeaway
Learn sessions using the financial centre’s local time and allow your charting platform to convert them into your own time zone.
Session Opens
- The start of a major session can increase activity
- New market participants and orders become active
- Volatility may increase
- The first move does not always become the session’s main direction
The beginning of London or New York can bring a noticeable change in market activity.
More banks, institutions, businesses and traders become involved as their working day begins.
This can produce:
- stronger candles
- breakouts
- reversals
- tests of earlier highs and lows
However, a strong move immediately after a session opens does not guarantee that price will continue in that direction.
For additional chart assistance, search TradingView Indicators for:
- London Open
- New York Open
- Session Open Lines
Key Takeaway
Session opens can bring activity, but the first move should not automatically be treated as the direction of the whole session.
Session Overlaps
- Two major regions can be active at the same time
- London and New York overlap
- More participation can mean increased liquidity
- Your local overlap time can shift when daylight-saving changes occur
London is still active when New York begins trading.
This creates the London–New York overlap.
With participants from both regions active, the market can experience increased liquidity and stronger movement.
This period is particularly relevant to many major forex pairs.
Again, traders living elsewhere should avoid memorising the overlap purely by their own clock because daylight-saving changes can alter its local appearance.
Key Takeaway
Understand which sessions are active rather than relying on one permanently memorised local time.
Session Highs and Lows
- Every session creates a highest and lowest price
- Those levels remain visible after the session ends
- Later sessions can return to them
- Orders may gather around obvious session extremes
During a session, price forms a session high and session low.
For example, after the Asian session has developed, traders approaching London can identify the highest and lowest prices reached during that period.
Later price may:
- approach the level
- reject from it
- break through it
- briefly move beyond it and return
- continue through it
The level itself is not automatically a Buy or Sell signal.
It is simply a visible price area that other market participants can also see.
Useful indicator searches include:
- Session High Low
- Previous Session High Low
- Asia Range
- London Range
- Session Range
Key Takeaway
Previous session highs and lows can become important reference levels for later price movement.
Understanding Liquidity
What Liquidity Is
- Markets need buyers and sellers
- Orders need counterparties
- More liquid markets usually allow easier execution
- Large orders require sufficient opposite-side interest
Liquidity is essentially the availability of orders that allow transactions to take place.
If you want to buy, somebody must ultimately be willing to sell.
If you want to sell, somebody must ultimately be willing to buy.
For a small retail position this may seem insignificant, but large institutions can execute very large orders.
Those orders need sufficient market liquidity to be filled.
This is one reason areas containing large concentrations of orders can become important.
Key Takeaway
Liquidity allows buyers and sellers to transact, and larger orders require sufficient opposite-side orders to be available.
Where Liquidity Can Build
Liquidity may be found around obvious areas such as:
- previous highs
- previous lows
- equal or similar highs
- equal or similar lows
- session highs and lows
- previous daily highs and lows
- obvious breakout levels
Imagine several traders have sold below the same obvious high.
Some may place Stop Loss orders above that high.
Other traders may be waiting to buy if price breaks above it.
This means multiple types of orders can exist around the same area.
The same concept can occur underneath obvious lows.
Traders often describe these concentrations as liquidity pools.
Useful TradingView searches include:
- Liquidity Zones
- Liquidity Levels
- Equal Highs and Lows
- Previous Day High Low
Key Takeaway
Obvious highs and lows can attract attention because multiple orders may be positioned around them.
Why Price Can Move Towards Liquidity
- Markets need orders in order to transact
- Obvious levels can contain concentrations of orders
- Triggered orders can create additional activity
- Large participants may require deeper liquidity
Price does not literally have a mind that decides to hunt a level.
But areas containing many orders can naturally become important because those orders provide the other side needed for transactions.
When price reaches an obvious high, for example:
- short traders’ Stop Losses may become Buy orders
- breakout traders may enter Buy orders
- existing traders may close positions
- larger participants may find additional liquidity
When many orders become active together, price can accelerate rapidly.
Key Takeaway
Price often becomes more active around areas containing concentrations of orders.
Liquidity Sweeps
- Price trades beyond an obvious high or low
- Orders around the level are triggered
- Price then moves back through the level
- A sweep may lead to reversal, but does not guarantee one
Suppose price approaches a previous session high.
Price moves above the high, triggering orders sitting around that level.
Instead of continuing higher, price then falls back below the previous high.
Traders may describe this as a:
- Liquidity Sweep
- Liquidity Grab
- Stop Run
- Stop Hunt
These terms generally describe similar behaviour.
For indicator assistance, search:
- Liquidity Sweep
- Liquidity Grab
- High Low Sweep
- Stop Hunt
It is better to think of this as price interacting with concentrated orders, rather than imagining that the entire market is deliberately targeting one individual trader’s Stop Loss.
Key Takeaway
A liquidity sweep occurs when price trades beyond an obvious level and then fails to remain beyond it.
How Stops Can Become Liquidity
A Stop Loss is itself an order.
If many traders place their stops around similar obvious levels, those stops can create concentrated order flow.
For example:
Traders selling below a previous high may place Stop Losses above that high.
If price reaches the high and continues through it, those Stop Losses can become Buy orders.
Similarly, traders buying above an obvious low may place Stop Losses below it.
If price falls through that low, those stops can become Sell orders.
This helps explain why obvious highs and lows can sometimes experience very fast price movement when they are reached.
Key Takeaway
When many Stop Loss orders sit near the same level, triggering them can add to market activity.
Liquidity Hunt or Genuine Breakout?
- Not every broken high or low is a liquidity sweep
- Price may genuinely break and continue
- What happens after the break is important
- Avoid predicting the outcome before price shows you
Suppose price breaks above the London high.
Two broad outcomes are possible.
Sweep
Price trades above the high, fails to hold and moves back below it.
Breakout
Price trades above the high, remains above it and continues higher.
At the moment price first crosses the high, you cannot know with certainty which will happen.
Traders may therefore look for additional information such as:
- candle closes
- market structure
- strength of the move
- retests
- subsequent highs and lows
Key Takeaway
A broken high or low is not automatically a liquidity hunt. Sometimes price is simply continuing through the level.
Sessions and Liquidity Together
- One session can create levels for the next
- Previous session extremes remain visible
- New sessions bring new market participation
- Later price may seek or react around earlier liquidity
Imagine the Asian session creates a clear high and low.
London opens.
Price moves towards the Asian high.
It then trades through that level.
Instead of immediately assuming a reversal, watch what happens next.
Does price:
- remain above it?
- quickly reject?
- return inside the Asian range?
- change market structure?
- continue strongly higher?
Later, New York can interact with levels created during London in exactly the same way.
This is why intraday traders often keep previous session highs and lows marked on their charts.
Useful indicator searches include:
- Session Liquidity
- Previous Session Levels
- Session Range
- Liquidity Sweeps
Key Takeaway
Sessions create visible levels, and later sessions may interact with the liquidity around those levels.
Liquidity and Market Structure
- Liquidity provides areas of interest
- Market structure provides context
- A sweep can occur with or against the wider trend
- The reaction after liquidity is taken is often more informative than the sweep itself
In the previous lesson, you learned how price forms market structure.
Liquidity should not replace that analysis.
Suppose a market is strongly bullish.
Price temporarily moves underneath a short-term low, takes the liquidity sitting there and then quickly recovers.
That event can have a very different meaning from the same sweep occurring inside a strongly bearish structure.
Rather than simply asking:
“Has liquidity been taken?”
also ask:
“What did price do after it was taken?”
Key Takeaway
Liquidity identifies areas where orders may exist. Market structure helps explain the context surrounding those areas.
Common Sessions and Liquidity Mistakes
- Using incorrect session times
- Forgetting daylight-saving changes
- Marking every high and low as important liquidity
- Assuming every sweep guarantees reversal
- Assuming every breakout will continue
- Treating liquidity indicators as automatic trade signals
- Believing the market is targeting you personally
- Ignoring wider market structure
Session and liquidity tools should make the chart easier to understand.
They should not replace your understanding of what price is actually doing.
Key Takeaway
Use indicators to organise information on the chart, not to make trading decisions for you.
Sessions & Liquidity — Key Takeaways
You should now understand that:
- forex activity moves between global financial centres
- session times should be understood in the market’s own local time
- traders in different countries must account for time-zone differences
- daylight-saving changes can shift session times on your local clock
- session highs and lows can become important later
- liquidity represents the availability of orders
- orders can concentrate around obvious highs and lows
- Stop Losses can contribute to those concentrations
- price may trade through liquidity before reversing
- price may also break through and continue
- sessions, liquidity and market structure can be studied together
Remember
Do not focus only on where liquidity appears to be. Pay attention to how price behaves once it reaches that area.
Continue Learning
Next: Trading Psychology
Now that you understand when markets become active and where orders may be concentrated, the next lesson focuses on the trader making the decisions.