Learn the Foundations of Trading
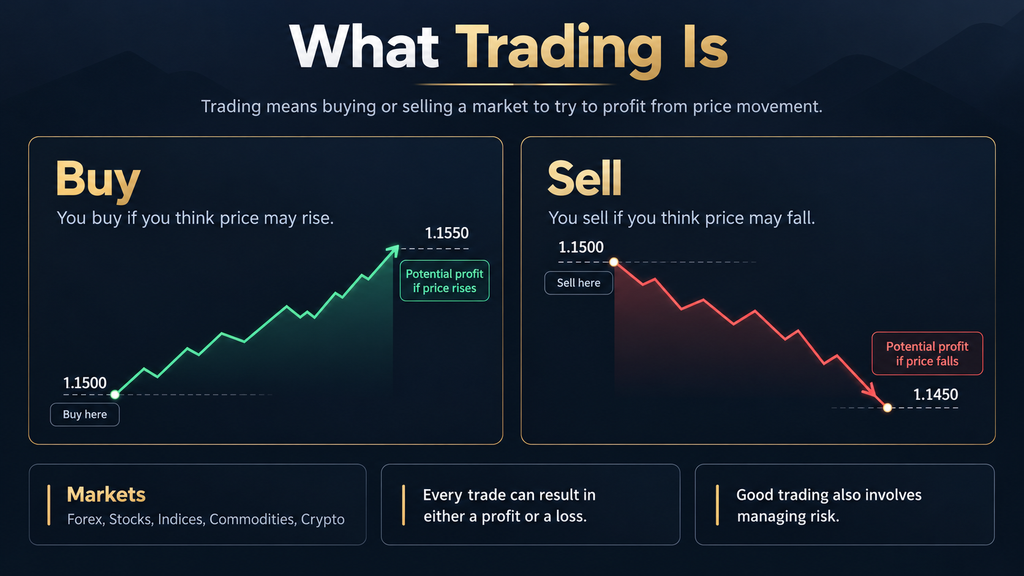
Trading is the act of buying or selling a financial market with the aim of making a profit from a change in price.
A trader does not need a market to move upwards to make money. You can:
- Buy if you believe the price may rise.
- Sell if you believe the price may fall.
For example, if EUR/USD is trading at 1.1500 and you buy because you believe it will rise, you could make a profit if the price moves to 1.1550.
If the price moves against you instead, the trade would make a loss.
Trading can involve different markets, including:
- Forex
- Stocks
- Indices
- Gold and other commodities
- Cryptocurrencies
The basic idea is always similar: you are trying to benefit from price movement while controlling how much you are prepared to risk.
Important to understand
Trading is not simply guessing whether a price will rise or fall. Traders normally use things such as charts, price behaviour, risk management and a trading plan to help make decisions.
No method can guarantee that an individual trade will be profitable.
Key takeaway
Trading means taking a position in a market because you expect its price to move, while accepting that the outcome can be either a profit or a loss.
Buy vs Sell
When you place a trade, you are choosing whether you think the price is more likely to move up or down.
Buying
A Buy trade is also called going long.
You buy when you believe the price may rise.
Example:
EUR/USD is trading at 1.1500.
You buy at 1.1500 and the price later rises to 1.1550.
If you close the trade at the higher price, the trade could make a profit.
If the price falls instead, the trade could make a loss.
Selling
A Sell trade is also called going short.
You sell when you believe the price may fall.
Example:
EUR/USD is trading at 1.1500.
You sell at 1.1500 and the price later falls to 1.1450.
If you close the trade at the lower price, the trade could make a profit.
If the price rises instead, the trade could make a loss.
One important point
You do not need to own a currency before placing a Sell trade with most retail forex trading platforms.
The platform allows you to take a position based on whether you expect the price to rise or fall.
Key takeaway
Buy when you expect price to rise. Sell when you expect price to fall. In either direction, the market can move against you and create a loss.
Currency Pairs
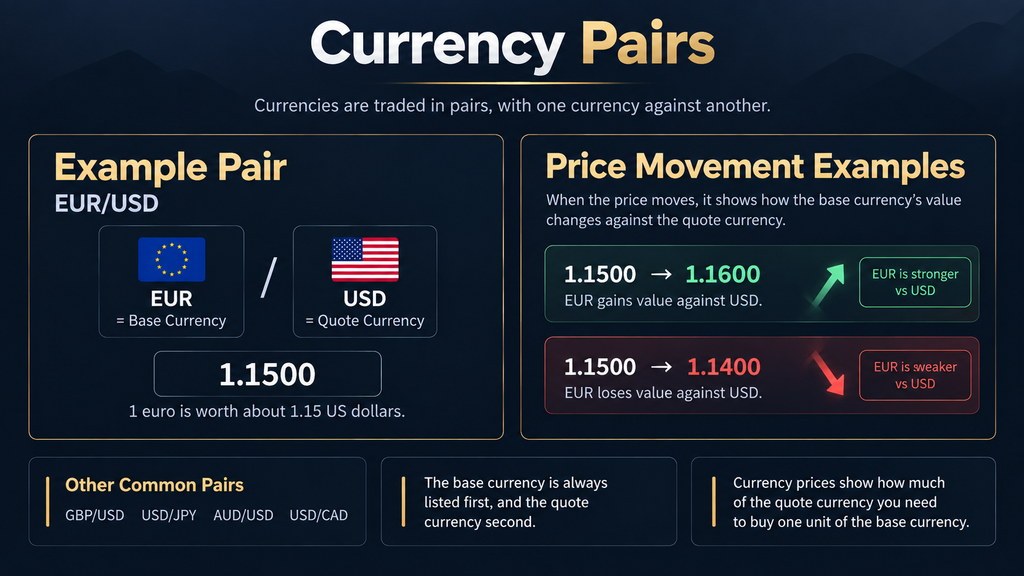
In forex trading, currencies are traded in pairs because you are always comparing the value of one currency against another.
A common example is:
EUR/USD
This represents the euro against the US dollar.
Base and Quote Currency
The first currency is called the base currency.
The second currency is called the quote currency.
For EUR/USD:
- EUR = base currency
- USD = quote currency
If EUR/USD is trading at:
1.1500
it means 1 euro is worth approximately 1.15 US dollars.
What Happens When the Price Moves?
If EUR/USD rises from 1.1500 to 1.1600, the euro has increased in value relative to the US dollar.
If EUR/USD falls from 1.1500 to 1.1400, the euro has decreased in value relative to the US dollar.
So when trading a currency pair, you are not simply asking whether one currency is strong or weak. You are comparing the strength of one currency against another.
Other Currency Pair Examples
GBP/USD — British pound against US dollar
USD/JPY — US dollar against Japanese yen
AUD/USD — Australian dollar against US dollar
USD/CAD — US dollar against Canadian dollar
Key Takeaway
A forex price shows the value of the first currency compared with the second. Understanding which currency is the base and which is the quote makes reading forex prices much easier.
Reading a Chart and Candlesticks
Open TradingViewAffiliate link to view charts while working through this section.
A trading chart shows how the price of a market has moved over time.
The vertical side of the chart shows price, while the horizontal direction represents time. Traders use charts to see whether price is rising, falling, moving sideways or reacting around particular price areas.
Timeframes
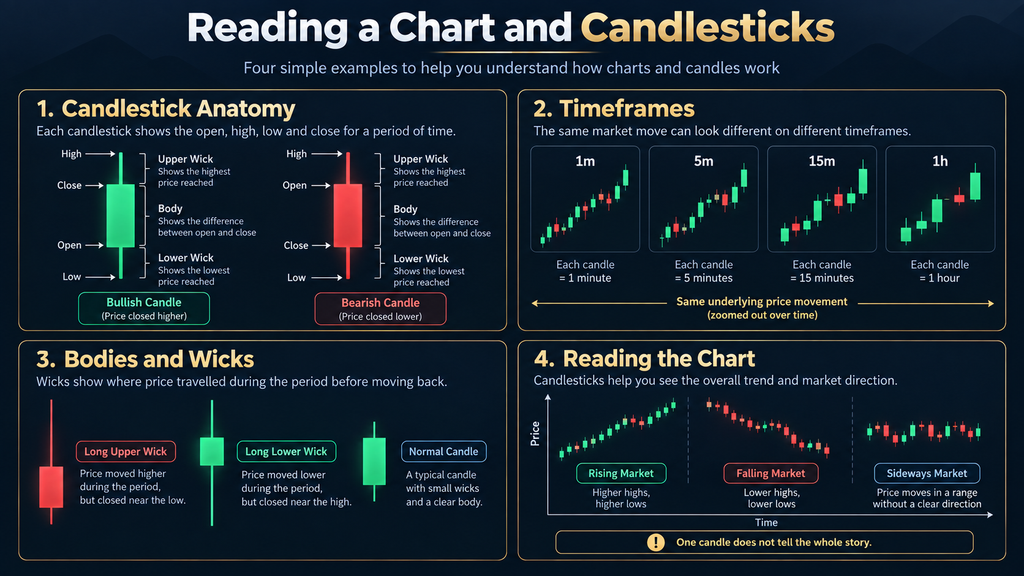
Charts can display price using different timeframes. The timeframe tells you how much time each candle represents.
- 1 minute — each candle represents 1 minute
- 5 minutes — each candle represents 5 minutes
- 15 minutes — each candle represents 15 minutes
- 1 hour — each candle represents 1 hour
- 1 day — each candle represents one trading day
Changing the timeframe does not change what happened in the market. It changes how that price movement is grouped and displayed on the chart.
What Is a Candlestick?
A candlestick shows how price moved during one period of time.
Every candle contains four important prices:
Open — where the candle started.
High — the highest price reached during that candle.
Low — the lowest price reached during that candle.
Close — where the candle finished.
Bullish Candles
A bullish candle forms when the closing price is higher than the opening price.
In simple terms, price finished that period higher than where it started.
Bearish Candles
A bearish candle forms when the closing price is lower than the opening price.
Price therefore finished that period lower than where it started.
Candle Bodies and Wicks
The thicker section of a candlestick is called the body. It shows the distance between the opening and closing prices.
The thin lines extending above or below the body are called wicks.
Wicks show prices that were reached during the period but were not maintained by the time the candle closed.
For example, a long upper wick tells you that price moved higher but then moved back down before that candle finished.
One Candle Does Not Tell the Whole Story
A bullish candle does not guarantee that price will continue higher, and a bearish candle does not guarantee that price will continue lower.
Traders normally consider several candles together, the wider price movement and where those candles have formed on the chart.
Key Takeaway
Candlesticks show how price moved during a specific period. Learning to recognise the open, high, low, close, body and wicks gives you one of the basic foundations needed to read a trading chart.
Pips and Points
When a market price moves, traders need a simple way to describe how far it has moved.
In forex, this is usually measured in pips.
What Is a Pip?
For most forex pairs, one pip is a movement of:
0.0001
For example, if EUR/USD moves from:
1.1500 → 1.1510
the price has moved 10 pips.
If it moves from:
1.1500 → 1.1550
the price has moved 50 pips.
Japanese Yen Pairs
Pairs containing the Japanese yen are slightly different.
For pairs such as USD/JPY, one pip is normally:
0.01
So if USD/JPY moves from:
156.20 → 156.30
that is a movement of 10 pips.
What Is a Point?
The word point is often used for markets such as gold, indices and cryptocurrencies.
A point simply describes a unit of price movement, but the exact size can depend on the market and the broker.
For example, if Bitcoin moves from:
$60,000 → $60,100
the price has moved $100, which may be described as a 100-point move depending on the platform.
Why Pips Matter
Pips help traders measure things such as:
- how far price has moved
- the distance to a Stop Loss
- the distance to a Take Profit
- potential profit or loss
- volatility
However, the number of pips alone does not tell you how much money you will make or lose.
The monetary value of a pip depends on factors such as your trade size, the currency pair and your account currency.
Relevant Trader Tool
Use our Pip Value Calculator to work out how much a pip is worth for a particular trade.
Lot Size
Lot size is the amount of a market you are trading.
In forex, trades are usually measured in lots rather than simply saying how many euros, pounds or dollars you are buying or selling.
Standard Lot Sizes
For most forex pairs:
- 1.00 lot = 100,000 units of the base currency
- 0.10 lot = 10,000 units
- 0.01 lot = 1,000 units
So if you trade 1.00 lot of EUR/USD, the position represents 100,000 euros.
Why Lot Size Matters
Lot size directly affects how much money you can gain or lose when price moves.
A larger lot size means each pip is worth more money.
A smaller lot size means each pip is worth less money.
For example, the same 20-pip move can produce very different results depending on whether you are trading:
- 0.01 lots
- 0.10 lots
- 1.00 lot
The market moved the same distance, but the money gained or lost is different because the position size is different.
Lot Size and Risk
Lot size should not usually be chosen at random.
A trader can decide how much money they are prepared to risk, then calculate a suitable lot size based on:
- account balance
- risk amount or percentage
- entry price
- Stop Loss distance
- the market being traded
This helps keep the amount at risk controlled before entering the trade.
Relevant Trader Tool
Use our Position Size / Lot Size Calculator to calculate a lot size based on your account balance, risk and Stop Loss.
Important to Understand
A large account does not automatically mean you should trade a large lot size.
The correct position size depends on how much you are prepared to lose if the trade does not work.
Key Takeaway
Lot size controls the size of your position and therefore how much money each price movement can gain or lose. Position size should be chosen based on risk, not simply on how much profit you want to make.
Spread
The spread is the small difference between the price at which you can buy a market and the price at which you can sell it.
You will often see two prices quoted:
- Bid — the price you can sell at
- Ask — the price you can buy at
The difference between them is the spread.
Simple Example
EUR/USD might show:
Bid: 1.1500
Ask: 1.1502
The difference is:
0.0002 = 2 pips
That 2-pip difference is the spread.
Why the Spread Matters
The spread is one of the costs of entering a trade.
If you buy a market and immediately close the trade without price moving, you would usually make a small loss because of the spread.
This means price normally needs to move slightly in your favour before the trade reaches break-even.
Spreads Can Change
Spreads are not always the same.
They can become wider when:
- markets are very volatile
- important economic news is released
- liquidity is lower
- markets are opening or closing
- your broker changes its pricing
A wider spread means the cost of entering the trade is higher.
Different Markets Have Different Spreads
Highly traded forex pairs such as EUR/USD often have relatively small spreads.
Less liquid currency pairs and other markets may have wider spreads.
The exact spread also depends on the broker and the type of trading account being used.
Spread and Your Results
The spread should be considered when calculating:
- entry price
- Stop Loss distance
- Take Profit distance
- potential profit or loss
- very short-term trades
This becomes especially important when the profit target or Stop Loss is small, because the spread represents a larger proportion of the trade.
Key Takeaway
The spread is the difference between the Buy and Sell price of a market. It is a trading cost, and wider spreads can make a trade more expensive to enter.
Stop Loss and Take Profit
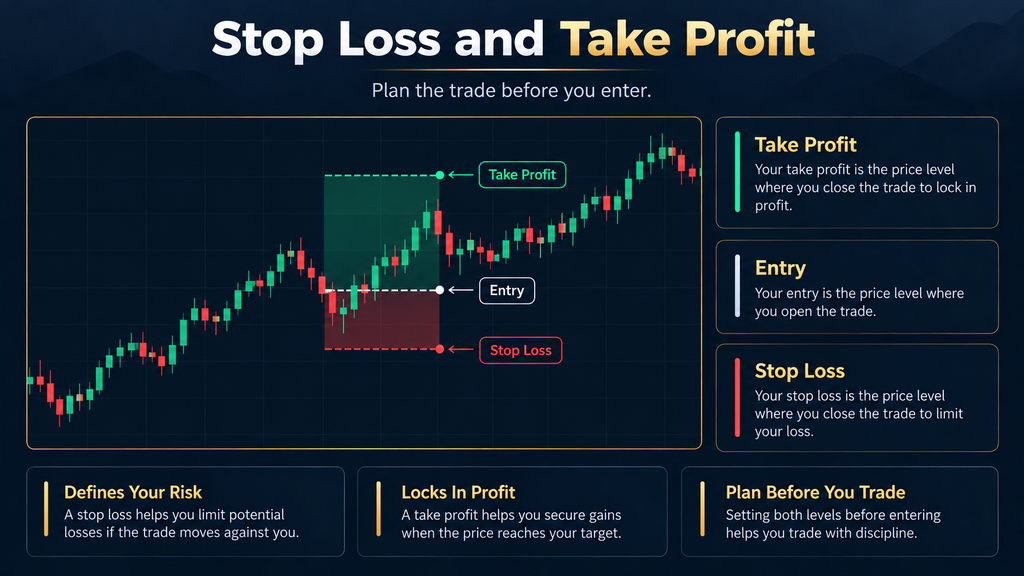
A Stop Loss and Take Profit are price levels that help you plan where a trade should end.
They can be set before or after entering a trade, depending on the platform you use.
What Is a Stop Loss?
A Stop Loss is a price level used to close a trade if the market moves against you.
Its purpose is to limit how much you can lose on that trade.
For example:
You buy EUR/USD at:
1.1500
You place a Stop Loss at:
1.1470
If price falls to 1.1470, the trade can automatically close.
The distance between your entry and Stop Loss is:
30 pips
What Is a Take Profit?
A Take Profit is a price level used to close a trade if price moves in your favour.
For example:
You buy EUR/USD at:
1.1500
You place a Take Profit at:
1.1560
If price rises to 1.1560, the trade can automatically close in profit.
The distance from your entry is:
60 pips
Stop Loss and Take Profit Work Together
Using both levels allows you to define:
- how much you are prepared to lose
- how far price needs to move for your target
- the potential reward compared with the risk
In the example above:
Risk: 30 pips
Potential reward: 60 pips
That gives a 2:1 reward-to-risk ratio.
Why This Matters
Without a Stop Loss, a losing trade can continue moving further against you.
Without a planned Take Profit, traders can sometimes stay in a trade too long or close it based on emotion rather than a plan.
Neither level guarantees a particular result, but they help create a more controlled and measurable trade.
Relevant Trader Tool
Use our Risk / Reward Calculator to compare your entry, Stop Loss and Take Profit before placing a trade.
Key Takeaway
A Stop Loss defines where you accept a loss, while a Take Profit defines where you plan to take profit. Together, they help you know your risk and potential reward before the trade begins.
Leverage and Margin
Leverage allows you to control a larger trading position using a smaller amount of your own money.
This means even a relatively small account can open a position that is much larger than the cash balance held in the account.
Simple Example
Imagine your broker offers:
30:1 leverage
This means that for every £1 of your own money, you may be able to control up to £30 of market exposure.
So:
£1,000 of your own funds could control a position worth up to approximately £30,000.
What Is Margin?
Margin is the amount of your own money that is set aside by the broker to keep a leveraged trade open.
It is not usually a fee.
It is more like a deposit that supports the position while the trade is active.
For example, if a position requires £500 margin, that £500 is being used to support the open trade.
Why Leverage Can Be Dangerous
Leverage increases your exposure to the market.
That means it can increase:
- potential profits
- potential losses
A small movement in price can therefore have a much larger effect on your account than it would without leverage.
This is why leverage should never be treated as extra money.
Margin Level and Forced Closures
If losses on open trades become too large, your available margin can fall.
Depending on your broker, this can eventually lead to:
- a margin warning
- a margin call
- positions being automatically closed
The exact rules depend on the broker and account type.
Leverage Does Not Decide Your Risk
Using 30:1 leverage does not mean you should risk 30 times more.
Your actual trade risk should still be controlled using:
- position size
- Stop Loss
- account balance
- the amount or percentage you are prepared to lose
Leverage simply determines how much market exposure your account can access.
Important Warning
High leverage can cause losses to build quickly.
A trader should understand how leverage and margin work before increasing position size.
Key Takeaway
Leverage lets you control a larger position with less capital, while margin is the amount of your own money needed to support that position. Leverage increases both opportunity and risk, so it should be used carefully.
Basic Order Types
An order is an instruction you give to your trading platform to open or close a trade.
The three basic order types beginners should understand are:
- Market Order
- Limit Order
- Stop Order
Market Order
A Market Order tells the platform to enter the trade at the best available current price.
For example:
EUR/USD is trading around 1.1500.
If you press Buy using a Market Order, the platform attempts to open the trade immediately at the best available price.
The final entry may be slightly different from the price you saw on screen, especially in a fast-moving market.
Limit Order
A Limit Order is used when you want to enter at a better price than the current market price.
For example:
EUR/USD is trading at:
1.1500
You want to buy only if price falls to:
1.1470
You can place a Buy Limit at 1.1470.
If price reaches that level, the platform can automatically open the trade.
A Sell Limit works in the opposite direction and is usually placed above the current price.
Stop Order
A Stop Order is used when you want to enter only after price moves beyond a certain level.
For example:
EUR/USD is trading at:
1.1500
You want to buy only if price rises to:
1.1530
You can place a Buy Stop at 1.1530.
If price reaches that level, the platform can attempt to open the trade.
A Sell Stop works in the opposite direction and is usually placed below the current price.
Easy Way to Remember
Market Order
Enter now.
Limit Order
Wait for price to come back to your chosen level.
Stop Order
Wait for price to move through your chosen level.
Important to Understand
Placing a pending order does not guarantee the exact price you will receive.
Fast markets, gaps and low liquidity can cause an order to be filled at a different price.
You should also make sure you understand whether an order is for entry, Stop Loss, or Take Profit, because trading platforms may use similar terminology in different places.
Key Takeaway
Market orders enter at the current available price. Limit orders wait for a more favourable price, while stop orders wait for price to move beyond a chosen level before entering.
Trading Basics — Key Takeaways
You now understand the basic mechanics behind placing and managing a trade.
You have learned:
- what trading is
- the difference between Buy and Sell
- how currency pairs work
- how to read charts and candlesticks
- what pips and points are
- how lot size affects trade value
- what the spread is
- how Stop Loss and Take Profit levels work
- what leverage and margin mean
- the basic order types used to enter trades
These concepts form the foundation for everything that comes later.
Before focusing on strategies, setups or advanced chart concepts, it is important to understand how a trade actually works and how risk is controlled.
Remember
A good trade is not simply one that makes money.
A well-planned trade has:
- a clear reason for entering
- a defined Stop Loss
- a planned target
- an appropriate position size
- an acceptable amount of risk
No trading strategy can guarantee profit, so protecting your account should always come before trying to maximise returns.
Continue Learning
The next section in the Learn area is:
Optional Knowledge Check
Test what you’ve learned. This quiz is optional and does not affect your access to other lessons.